Brexit voting analysis

Challenge 1: Brexit plot
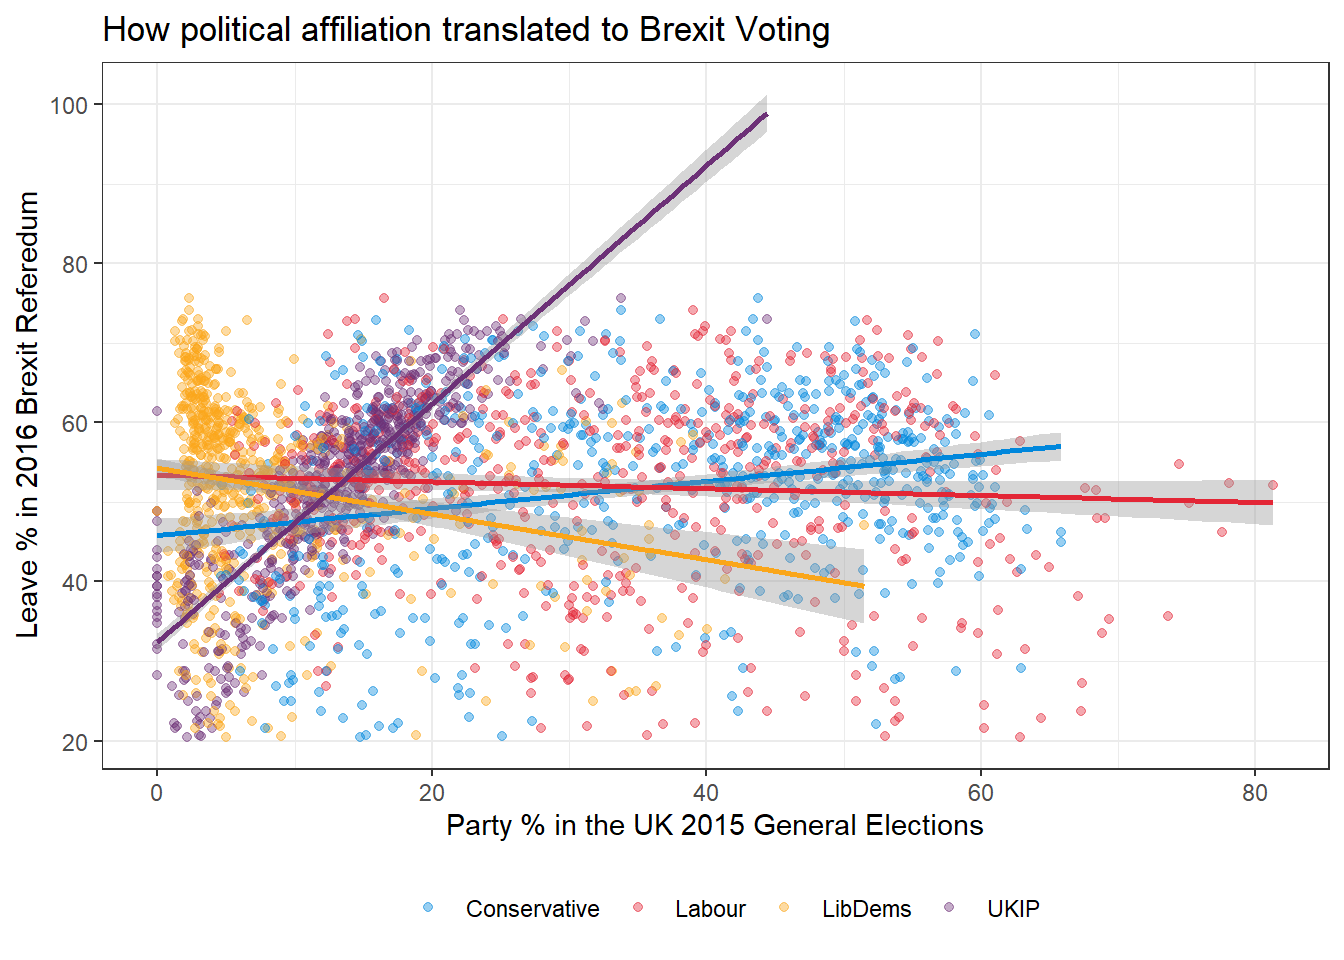
Using your data manipulation and visualisation skills, please use the Brexit results dataframe (the same dataset you used in the pre-programme assignement) and produce the following plot. Use the correct colour for each party; google “UK Political Party Web Colours” and find the appropriate hex code for colours, not the default colours that R gives you.
## Rows: 632 Columns: 11
## ── Column specification ────────────────────────────────────────────────────────
## Delimiter: ","
## chr  (1): Seat
## dbl (10): con_2015, lab_2015, ld_2015, ukip_2015, leave_share, born_in_uk, m...
##
## ℹ Use `spec()` to retrieve the full column specification for this data.
## ℹ Specify the column types or set `show_col_types = FALSE` to quiet this message.
## `geom_smooth()` using formula 'y ~ x'
##
## `geom_smooth()` using formula 'y ~ x'
##
## `geom_smooth()` using formula 'y ~ x'
##
## `geom_smooth()` using formula 'y ~ x'